What percentage of stolen cars are recovered?
Motor vehicle thefts have increased in recent years, but 59.3% of stolen cars are located. Stolen cars that are recovered are often damaged, and almost 25% are intentionally burned or wrecked.
Free Car Insurance Comparison
Compare Quotes From Top Companies and Save
Secured with SHA-256 Encryption
Kristen Gryglik
Licensed Insurance Agent
Kristen is a licensed insurance agent working in the greater Boston area. She has over 20 years of experience counseling individuals and businesses on which insurance policies best fit their needs and budgets. She knows everyone has their own unique needs and circumstances, and she is passionate about counseling others on which policy is right for them. Licensed in Massachusetts, New Hampshire,...
Licensed Insurance Agent
UPDATED: Nov 4, 2024
It’s all about you. We want to help you make the right coverage choices.
Advertiser Disclosure: We strive to help you make confident auto insurance decisions. Comparison shopping should be easy. We are not affiliated with any one auto insurance provider and cannot guarantee quotes from any single provider.
Our insurance industry partnerships don’t influence our content. Our opinions are our own. To compare quotes from many different companies please enter your ZIP code on this page to use the free quote tool. The more quotes you compare, the more chances to save.
Editorial Guidelines: We are a free online resource for anyone interested in learning more about auto insurance. Our goal is to be an objective, third-party resource for everything auto insurance related. We update our site regularly, and all content is reviewed by auto insurance experts.
UPDATED: Nov 4, 2024
It’s all about you. We want to help you make the right coverage choices.
Advertiser Disclosure: We strive to help you make confident auto insurance decisions. Comparison shopping should be easy. We are not affiliated with any one auto insurance provider and cannot guarantee quotes from any single provider.
Our insurance industry partnerships don’t influence our content. Our opinions are our own. To compare quotes from many different companies please enter your ZIP code on this page to use the free quote tool. The more quotes you compare, the more chances to save.
On This Page
- California accounts for the majority of car theft nationwide
- In 2019, the Honda Civic topped the list as the most stolen passenger vehicle
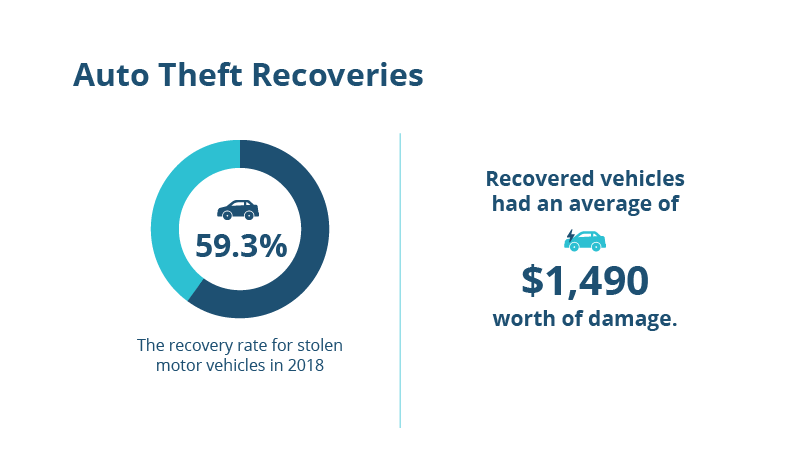
- According to the NCIB, the estimated vehicle recovery rate was 59.3% in 2018
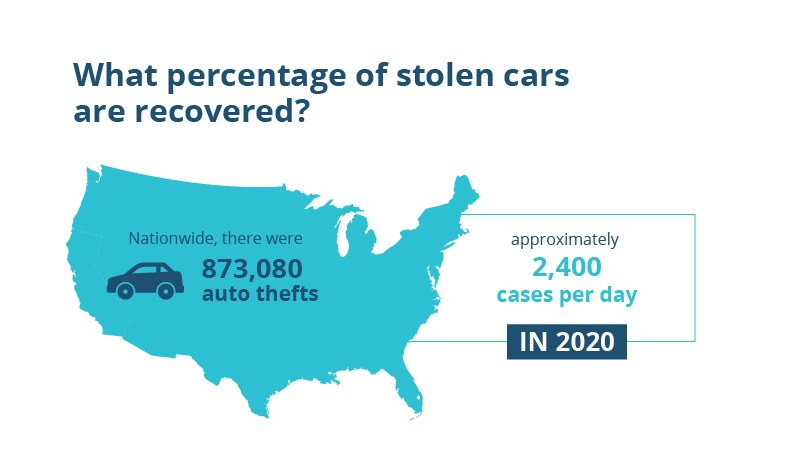
Car owners beware—last month, the National Insurance Crime Bureau (NICB) released its annual Hot Spot report and the numbers revealed a dramatic increase in auto-related crime. Nationwide, there were 873,080 auto thefts in 2020, approximately 2,400 cases each day. That was a 9% increase from the 721,885 thefts in 2019.
But what percentage of stolen cars are recovered? What states were most impacted? And which are the most stolen cars?
Before you read more about what percentage of stolen cars are recovered, take a minute to be sure you are covered. Enter your ZIP code for free car insurance quotes from top companies today.
How often are stolen cars found?
In 2020, a motor vehicle was stolen once every 36 seconds in the US. Added together, those thefts represented more than 7 billion dollars in property loss.
So, what percentage of those cars that are stolen are found?
The good news is that the vast majority of those vehicles end up being recovered eventually. Buckling down a specific number of recovered vehicles is difficult due to reporting lag and the fact that cars are recovered daily. However, if your car is stolen there’s a better than 50-50 chance that it’s recovered.
On the low-end, the NCIB estimated that the vehicle recovery rate for stolen motor vehicles in 2018 was 59.3%, meaning 300,000 motor vehicles went unrecovered. But, according to the California Highway Patrol’s 2020 Vehicle Theft report—the state with the most auto thefts by far—approximately 89.2% were recovered.
That said, the state of repair that California vehicles were recovered in does range from intact and drivable to totaled:
- 63.6% were intact and in drivable condition
- 3.1% were missing major components
- 8.6% were stripped of minor parts
- 24.6% were intentionally burned and/or wrecked
Also, the rate of recovery varied by vehicle:3
- 96% of automobiles
- 93.6% of personal trucks and SUVs
- 81.4% of commercial trucks
- 57.1% of motorcycles
Of the drivers that did get their cars back, there was an average of $1,490 worth of damage done to the car.
If your car is stolen without insurance, you will find yourself out-of-pocket whether or not your car is recovered. If it doesn’t turn up, you’ll have no coverage to replace it. And if it is one of the many that are located, you’ll have to pay for any damage done by the thieves yourself.
Be sure you add comprehensive coverage to your policy so that you have financial protection for a stolen vehicle.
Read more: Does my auto insurance cover a stolen car?
Compare over 200 auto insurance companies at once!
Secured with SHA-256 Encryption
How much did auto thefts increase in 2020?
Auto theft increased in 2020, but this isn’t unique. Most major and petty crimes increased rapidly across the board from 2019 to 2020, especially in major cities. Homicide, assault and battery, and grand theft auto all spiked.
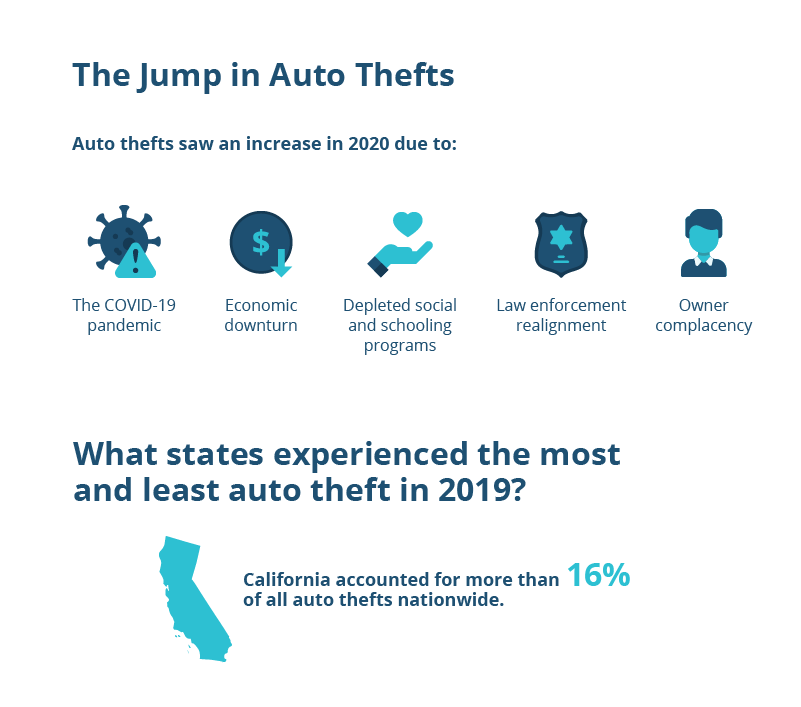
When asked about the factors that contributed to this increase, David Glawe, president and CEO of NICB had this to say: “Auto thefts saw a dramatic increase in 2020 versus 2019 in part due to the pandemic, an economic downturn, law enforcement realignment, depleted social and schooling programs, and in still too many cases, owner complacency.”
And the spike in auto theft from 2019 to 2020 was statistically significant when compared to the last decade.
Auto Thefts Year Over Year 2010-2020| Year | Number of Vehicles Stolen | Percent Change from Previous Year |
|---|---|---|
| 2010 | 739,565 | -7.0% |
| 2011 | 716,508 | -3.1% |
| 2012 | 723,186 | 0.9% |
| 2013 | 700,288 | -3.2% |
| 2014 | 686,803 | -1.9% |
| 2015 | 713,063 | 3.8% |
| 2016 | 767,290 | 7.6% |
| 2017 | 772,943 | 0.7% |
| 2018 | 751,904 | -2.7% |
| 2019 | 721,885 | -4.0 |
| 2020 | 873,080 | 9.2% |
There’s also a dramatic difference between 2019 and 2020 car thefts via a month-by-month comparison.
Auto Thefts by Month Year Over Year 2019-2020
| Month | 2019 | 2020 | Percent Change |
|---|---|---|---|
| January | 67,342 | 68,049 | 1.0% |
| February | 57,361 | 60,859 | 4.3% |
| March | 62,453 | 63,838 | 2.2% |
| April | 61,723 | 65,337 | 5.9% |
| May | 67,538 | 69,641 | 3.1% |
| June | 67,493 | 75,621 | 12.0% |
| July | 72,202 | 80,015 | 10.8% |
| August | 70,910 | 80,121 | 13.0% |
| September | 67,686 | 75,974 | 12.2% |
| October | 68,867 | 79,643 | 15.6% |
| November | 65,851 | 77,702 | 18.0% |
| December | 69,218 | 76,280 | 10.2% |
In the past, the summer months have always been the peak season for grand theft auto. But the percentage change between June and December was historic, not once dropping beneath double digits.
What states experience the most and least auto theft?
For some states, car theft is a much more significant issue than in others. Naturally, larger population hubs tend to have more cases, but the auto theft rate may vary. Take a look at the statistics from the FBI.
Top Ten States for Motor Vehicle Thefts| Rank | State | Number of Vehicles Stolen |
|---|---|---|
| 1 | California | 141,757 |
| 2 | Texas | 77,489 |
| 3 | Florida | 39,048 |
| 4 | Washington | 24,402 |
| 5 | Georgia | 23,776 |
| 6 | Colorado | 22,113 |
| 7 | Missouri | 21,072 |
| 8 | Tennessee | 19,180 |
| 9 | Illinois | 18,775 |
| 10 | Ohio | 18,672 |
California accounts for a significant majority—more than 16%—of all car thefts nationwide. By grand theft auto rates, the Golden State is overrepresented, seeing as its population accounts for 12% of American citizens.
And which states have the fewest total number of vehicles stolen?
States With the Least Motor Vehicle Thefts| Rank | State | Number of Vehicle Thefts |
|---|---|---|
| 1 | Vermont | 298 |
| 2 | Wyoming | 713 |
| 3 | Maine | 726 |
| 4 | New Hampshire | 893 |
| 5 | Rhode Island | 1,358 |
| 6 | Idaho | 1,571 |
| 7 | Delaware | 1,604 |
| 8 | South Dakota | 1,756 |
| 9 | North Dakota | 1,792 |
| 10 | Washington, D.C. | 2,333 |
Despite only having 692,000 people, the nation’s capital far outpaced entire states with comparable population sizes. In fact, by rate, DC is by far the worst major locale in the country in terms of auto theft. This is why it’s important to contextualize the raw numbers by adjusting to per population rates in order to paint a more accurate risk profile.
Highest Rate of Motor Vehicle Thefts by State per 100,000 Population| Rank | State | Thefts per 100,000 residents |
|---|---|---|
| 1 | Washington, D.C. | 562.98 |
| 2 | Colorado | 502.12 |
| 3 | California | 475.24 |
| 4 | Missouri | 453.63 |
| 5 | New Mexico | 426.19 |
| 6 | Oregon | 385.08 |
| 7 | Oklahoma | 375.28 |
| 8 | Washington | 368.46 |
| 9 | Nevada | 365.84 |
| 10 | Kansas | 325.28 |
What Cities Have the Most Stolen Vehicles?
Even though DC experienced a higher rate of auto theft than any US state, it pales in comparison to other cities scattered throughout the country. In 2020, these metropolitan statistical areas (MSAs) had the highest rate of auto theft per 100,000 residents:
Top Cities for Motor Vehicle Thefts per 100,000 Population| Rank | City | Vehicle Thefts per 100,000 Residents |
|---|---|---|
| 1 | Bakersfield, CA | 905.41 |
| 2 | Yuba City, CA | 724.46 |
| 3 | Denver, CO | 705.8 |
| 4 | Odessa, TX | 664.28 |
| 5 | San Francisco, CA | 655.2 |
This marked the second year that Bakersfield has topped the list of most car thefts per 100,000 residents. Of the top ten US MSAs for grand theft auto, three were in California, and two in Colorado. The remaining cities were in Kansas, Missouri, Montana, New Mexico, Oklahoma, and Texas.
What vehicles were the most often stolen?
Cars are typically stolen for one of three reasons:
- Temporary transportation to or from a crime
- To strip the car of valuable parts
- To re-sell it
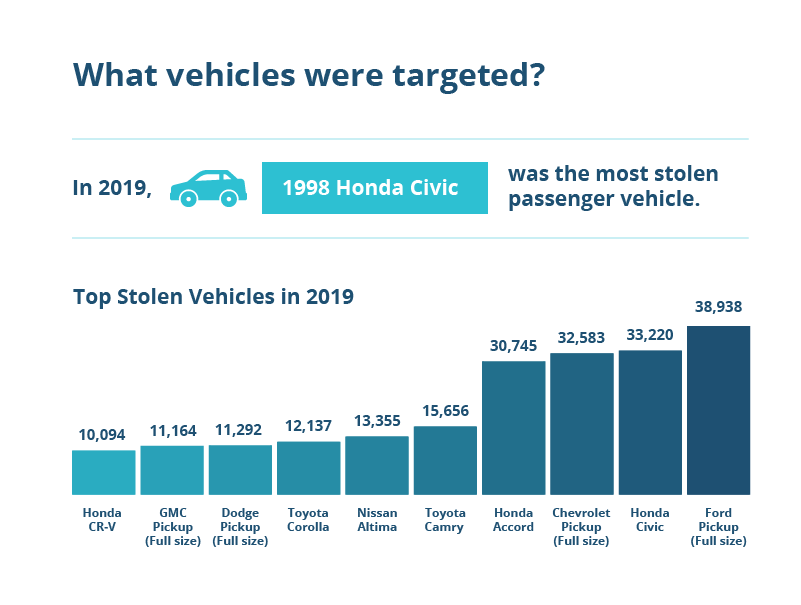
Certain cars are more likely to be targeted for theft than others, especially when it comes to reason number one. In 2019, the Honda Civic topped the list as the most stolen passenger vehicle, namely, the 1998 model. This is because it’s one of the most commonly owned sedans in the country and the older cars —specifically, 1998-2000—are easier than most cars to steal.
The top ten stolen vehicles for all models and all years in 2019 were:
- Ford Pickup (Full size) – 38,938
- Honda Civic – 33,220
- Chevrolet Pickup (Full size) – 32,583
- Honda Accord – 30,745
- Toyota Camry – 15,656
- Nissan Altima – 13,355
- Toyota Corolla – 12,137
- Dodge Pickup (Full size) – 11,292
- GMC Pickup (Full size) – 11,164
- Honda CR-V – 10,094
When were vehicles most likely to be stolen?
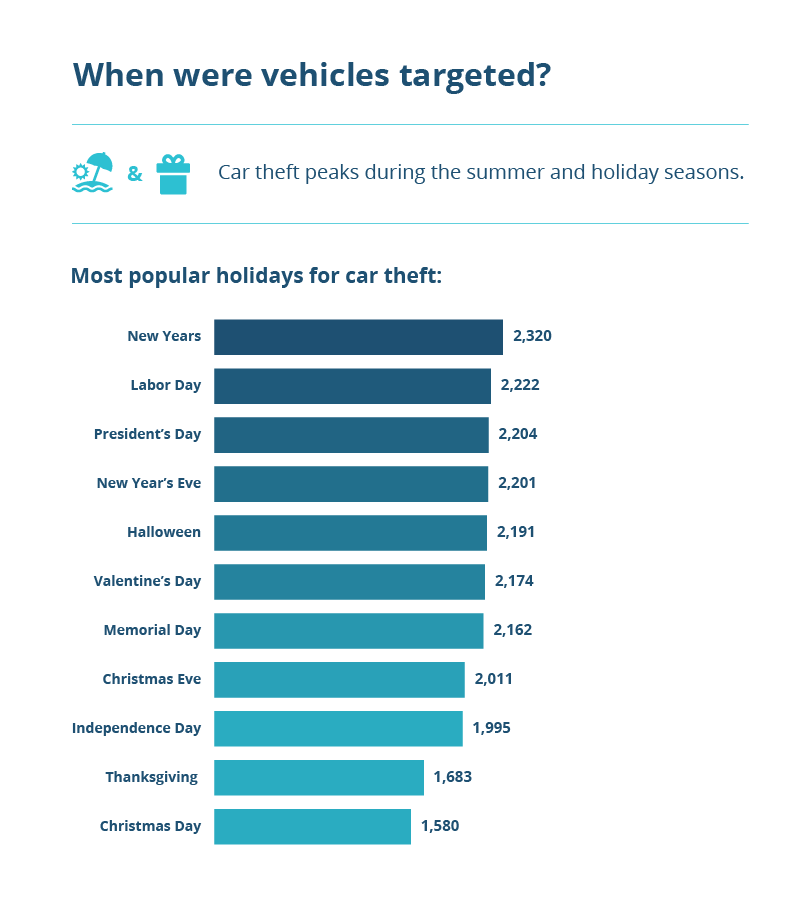
Aside from the summer months, holidays were the most common days for auto theft, which makes sense because people are often preoccupied with celebrations or out of town.
In 2019, the most popular holidays for car thieves were:
- New Year’s – 2,320
- Labor Day – 2,222
- President’s Day – 2,204
- New Year’s Eve – 2,201
- Halloween – 2,191
- Valentine’s Day – 2,174
- Memorial Day – 2,162
- Christmas Eve – 2,011
- Independence Day – 1,995
- Thanksgiving – 1,683
- Christmas Day – 1,580
Of course, cars can be stolen any time, and it’s often a crime of opportunity.
Compare over 200 auto insurance companies at once!
Secured with SHA-256 Encryption
What steps can you take to prevent auto theft?
According to the California Highway Patrol, the vast majority of grand theft auto crimes are crimes of opportunity—the car owner leaves the car idling, keeps the keys in the vehicle, or leaves valuables in plain sight.
Fortunately, this means there are easy steps you can take to dissuade would-be thieves. As one former car thief put it, “Don’t be an easy target. Lock your doors. Do not leave valuables like change, sunglasses, or a purse in plain view. If you have a commonly stolen car, like a mid-90’s Honda, use a steering wheel lock, like the Club. Do not make the mistake of thinking your car is not valuable enough to steal.”
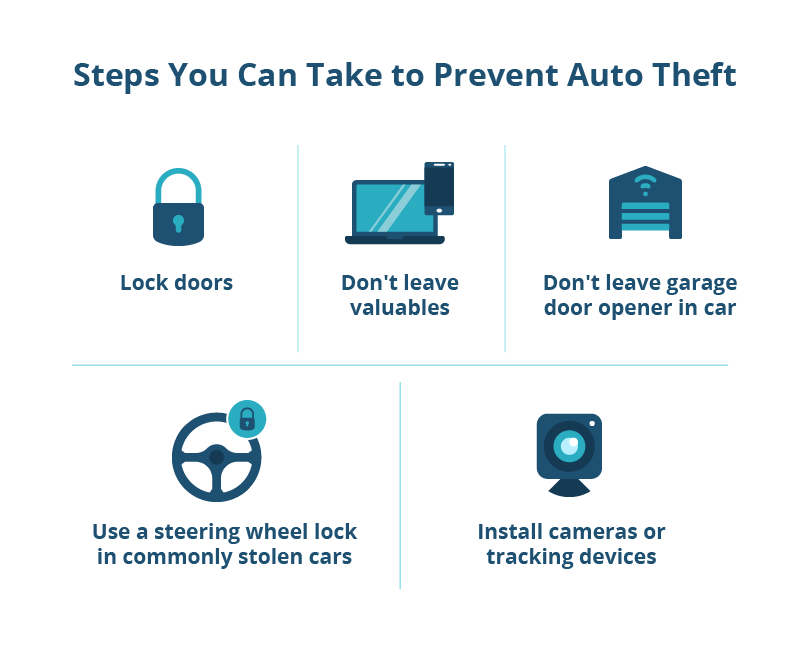
So, how do you avoid being an easy mark? Remember the following advice:
- Always lock your vehicle
- Set the car alarm and take all keys or FOBs
- Don’t leave your garage door opener in the car
- Don’t leave your registration and personal papers in the vehicle; instead, keep pictures or scans on your phone
- Don’t leave the car unlocked and running
- If your car is stolen, call the police first, then the insurance company
- Install cameras or tracking devices
Make sure you know how to report a stolen car to ensure your insurance claim goes smoothly.
Understanding Stolen Car Recovery Trends and Statistics
Car Theft and Recovery: A Statistical Insight
The stolen car recovery rate varies across different regions, influenced by factors such as local law enforcement efficiency and the availability of advanced tracking technologies.
On average, the percentage of stolen cars that are recovered can be as high as 50-60%, depending on the area. Understanding the chances of finding a stolen car involves considering variables such as the promptness of the report, the technology in the car, and the city’s resources.
In some areas, particularly those with high crime rates, the chances of a stolen car being recovered can be lower, while in others with better surveillance and quick response teams, the chances improve. Typically, whether stolen cars get found usually depends significantly on whether the vehicle is equipped with tracking devices.
For instance, where most stolen cars are found can vary from local neighborhoods to chop shops, highlighting the importance of prompt and coordinated recovery efforts to successfully recover stolen vehicles.
Analyzing car theft statistics by city, it is evident that urban areas often experience higher rates of vehicle thefts, with certain cities being labeled as the car theft capital of USA due to their disproportionately high rates.
Despite this, theft recovery cars have seen an improvement in recovery rates thanks to modern technology and law enforcement strategies. Ultimately, the dynamic between theft rates and recovery efforts is crucial in understanding and improving the overall stolen car recovery rate across various regions.
Compare over 200 auto insurance companies at once!
Secured with SHA-256 Encryption
Motor Vehicle Theft: A Global Perspective
Stolen Car Recovery: The Bottom Line
Outside of buying a home, a car is often the most expensive piece of property people own. Even though grand theft auto is on the rise, most cars will eventually be recovered—although the state of repair they’re recovered in varies. Because of this, it pays to insure your vehicle. That way, whether your car is in an accident or stolen, you’ll be protected from financial risk.
The right car insurance can make the experience of having your car stolen a little easier. Buying comprehensive coverage and adding rental car reimbursement ensures you’ll be protected financially.
While you’re waiting to find out if your stolen car will be recovered, a good insurance policy can get you back on the road. Compare free auto insurance quotes from top companies when you enter your ZIP code below, and make sure you have coverage for a stolen car.
Compare over 200 auto insurance companies at once!
Secured with SHA-256 Encryption
Frequently Asked Questions
What percentage of stolen cars are recovered?
Approximately 59.3% of stolen cars are located, but they are often damaged, and about 25% are intentionally burned or wrecked.
How much did auto thefts increase in 2020?
Auto thefts increased in 2020, with a significant spike compared to the previous decade. Factors contributing to the increase include the pandemic, economic downturn, law enforcement realignment, depleted social and schooling programs, and owner complacency.
What states experience the most and least auto theft?
California has the highest number of car thefts, accounting for over 16% of all thefts nationwide. On the other hand, the District of Columbia has the fewest total number of vehicles stolen.
What cities have the most stolen vehicles?
Bakersfield, California, topped the list of cities with the highest rate of auto thefts per 100,000 residents. Other cities with high rates include several in California, Colorado, Kansas, Missouri, Montana, New Mexico, Oklahoma, and Texas.
What vehicles were most often stolen?
In 2019, the Honda Civic (particularly the 1998 model) was the most stolen passenger vehicle. The top ten stolen vehicles included various models from different manufacturers.
How many cars have been recovered?
In the United States, around 400,000 stolen vehicles are recovered each year, reflecting the efforts of law enforcement and tracking technologies.
How often are stolen vehicles recovered?
Stolen vehicles are typically recovered within a few days to a few weeks, with many being found abandoned or stripped for parts.
How many cars get stolen a day?
On average, about 2,000 cars are stolen each day in the United States, illustrating the significant and ongoing issue of vehicle theft.
Where do stolen cars go?
Stolen cars are often taken to chop shops where they are dismantled for parts, shipped overseas, or resold with altered identification numbers.
What percentage of stolen cars are due to unlocked doors?
Approximately 50% of vehicle thefts occur due to unlocked doors, highlighting the importance of basic security measures in preventing theft.
How much does theft patrol cost?
The cost of theft patrol services can vary, but generally, it ranges from $20 to $50 per month for basic vehicle tracking and recovery services.
Compare over 200 auto insurance companies at once!
Secured with SHA-256 Encryption
Kristen Gryglik
Licensed Insurance Agent
Kristen is a licensed insurance agent working in the greater Boston area. She has over 20 years of experience counseling individuals and businesses on which insurance policies best fit their needs and budgets. She knows everyone has their own unique needs and circumstances, and she is passionate about counseling others on which policy is right for them. Licensed in Massachusetts, New Hampshire,...
Licensed Insurance Agent
Editorial Guidelines: We are a free online resource for anyone interested in learning more about auto insurance. Our goal is to be an objective, third-party resource for everything auto insurance related. We update our site regularly, and all content is reviewed by auto insurance experts.
